Introduction
At imgix, we believe that the data surrounding your images is almost as important as the images themselves, which is why we’re working hard to provide more useful data within the Analytics Dashboard. Today we’re announcing new Analytics functionality for our premium customers as well as some major improvements to the functionality of the Analytics Dashboard overall.
Audience Analytics for Premium Customers
For many customers there are significant business insights within the data that their images generate. Audience Analytics is designed to help those customers understand not only what types of devices and browsers are being used to view their images, but also to understand where the traffic to their images is coming from. The initial dimensions that Audience Analytics breaks down traffic along include:
- Device: PC, smart phone, crawler, etc.
- Operating system: Mac OS X, Windows, etc.
- Browser: Chrome, Safari, Firefox, etc.
- Referrer: The top-level domain of the referrers
If you are already a premium customer you can access this functionality from within the new Audience tab in the Analytics view of the Dashboard. If you are interested in gaining access to this new functionality please contact your account executive or request a demo here.
Analytics Dashboard Improvements
In addition to providing Audience Analytics for premium customers, we’ve also made a number of noteworthy updates to the Analytics Dashboard. These improvements are available to all imgix users and include hourly analytics updates, traffic source analysis, and an overall refresh to the Analytics navigation experience.
Hourly Updates
Previously, imgix provided analytics that were updated four times a day. Now, analytics are updated hourly. With more real-time information, you can monitor your traffic patterns more closely. When there are errors, you can also catch them more quickly, resulting in faster and easier debugging.
Easily Accessible Per-Source Analytics
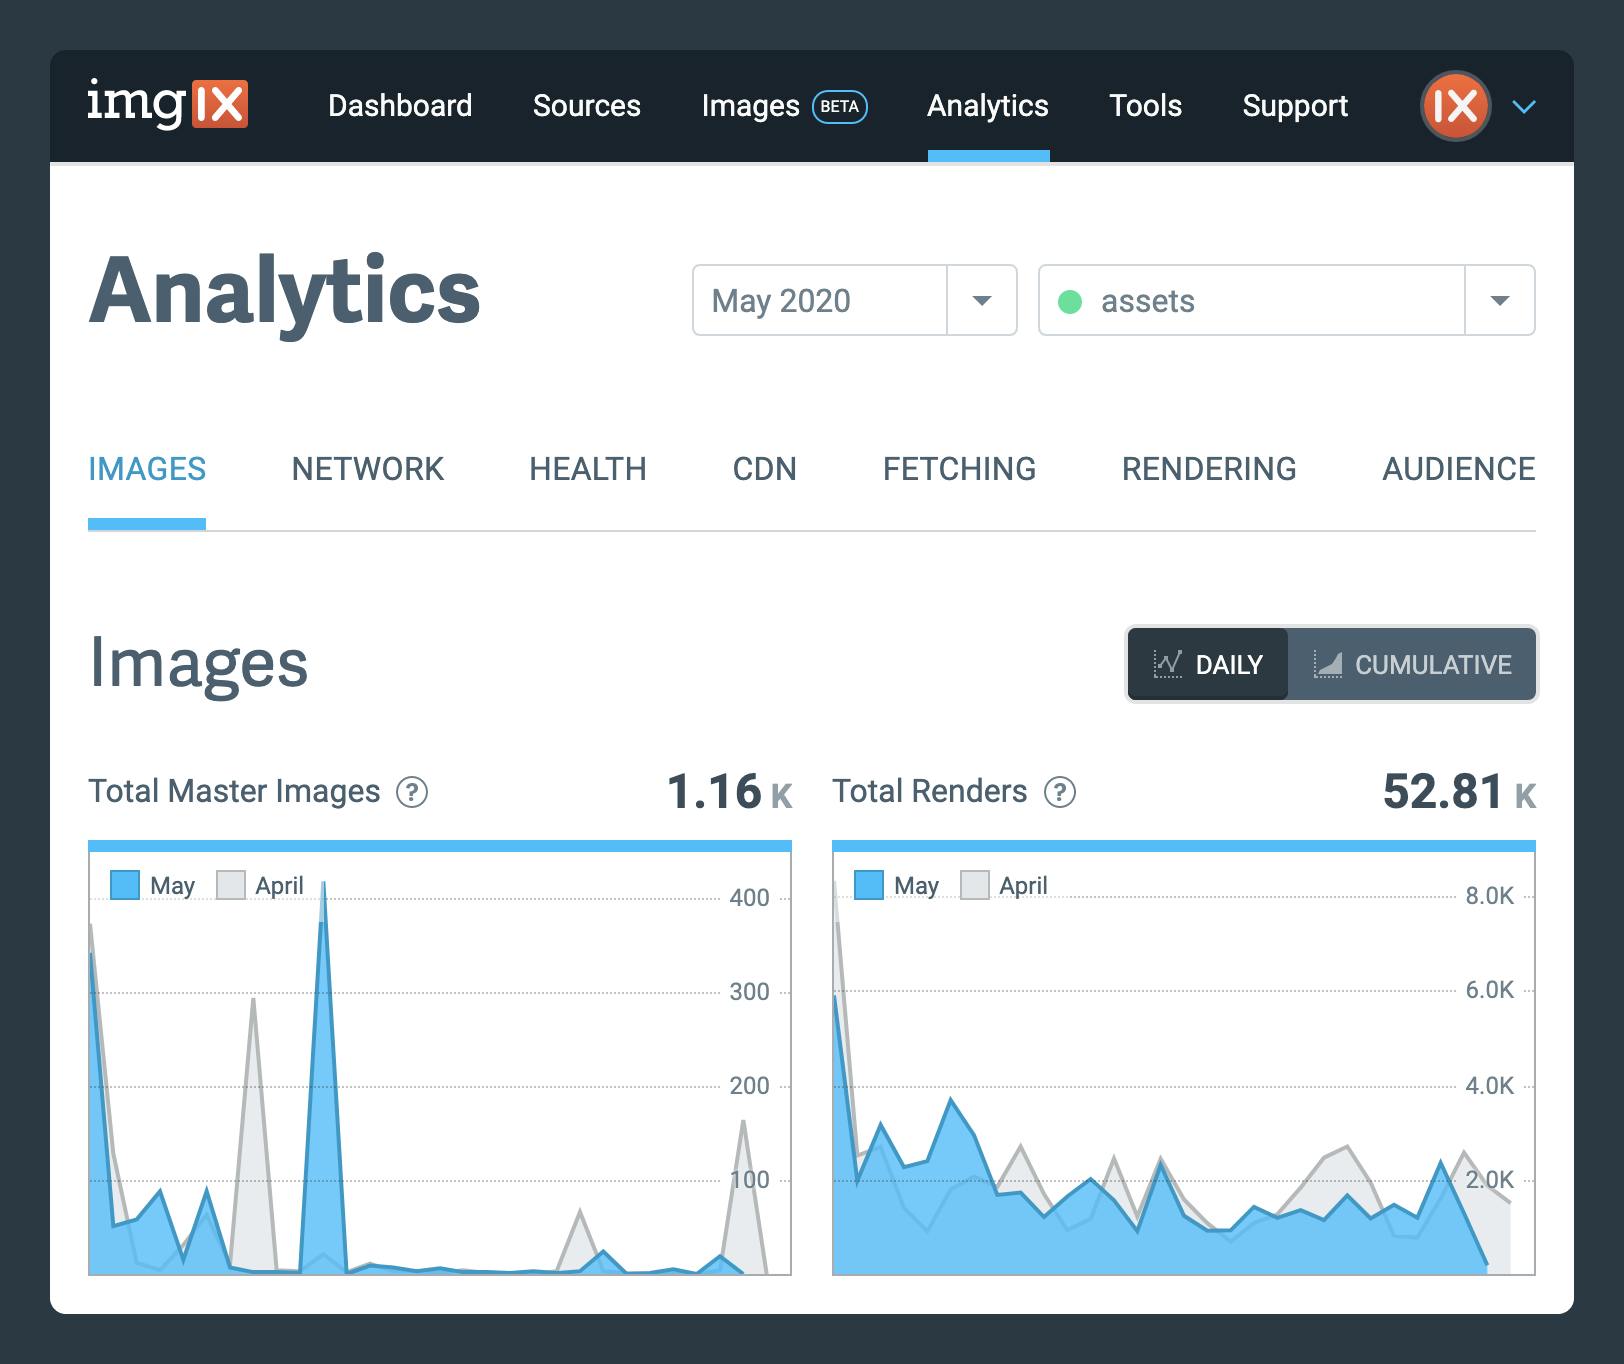
Did you know you can easily view your analytics by Source? With a detailed breakdown of traffic patterns, you can learn more about how your website is used and, again, catch errors more easily because they can be traced to a specific Source. The new breakdown also gives users the flexibility to see Master Image counts and bandwidth metrics by Source—especially handy for those who develop sites for multiple clients, or who use different Sources for their internal departments.
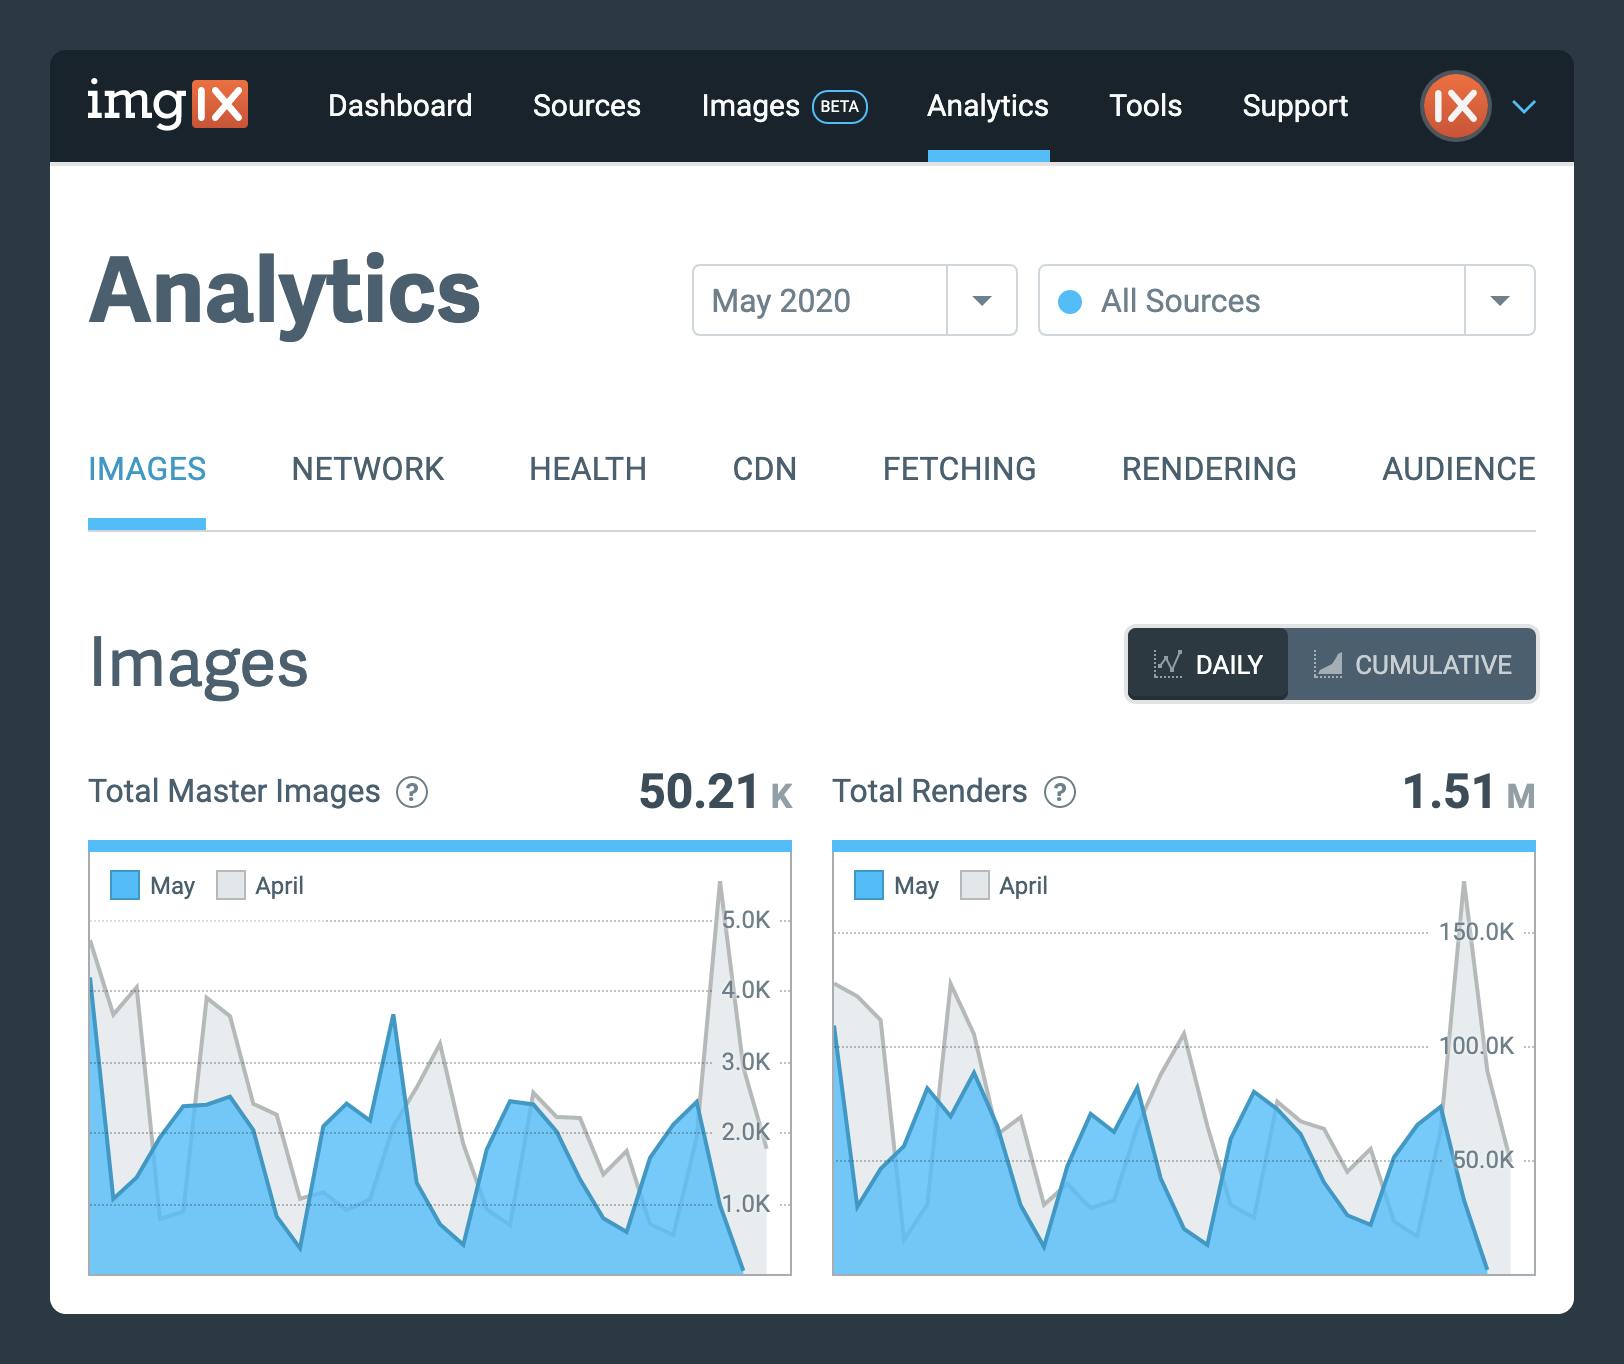
Our improved Analytics navigation not only allows users to filter by Source, but also to switch between their Sources seamlessly. In the Analytics view of the Dashboard, you will see a “All Sources” button at the top right corner:
No matter where you are in the Analytics view, clicking on this button will always bring up a list of your Sources:
Choosing a specific Source from this list will load your analytics for that Source. If you’re ever in question of which Source you’re looking at, just glance at the top right corner of your Analytics view; the Source name (here, “assets”) appears there.
To return to your default Analytics, simply select “All Sources” from the dropdown.
This design places your Sources at your fingertips, allowing quick access to your Source-specific analytics. It’s also easy to switch between Sources for ready comparisons.
Faster, Easier Navigation
In the process of implementing these improvements and new features, we have also updated the Analytics navigation experience at large. Tabs allow you to jump directly to the information you’re looking for, rather than scrolling to search for it.
Head on over to your account’s Analytics page to check out the new and improved experience. As always, don’t hesitate to contact support@imgix.com with your comments, questions, and wishes.


